Introduction to Eukaryotic Animal Cells: Eukaryotic Animal Cell Coloring

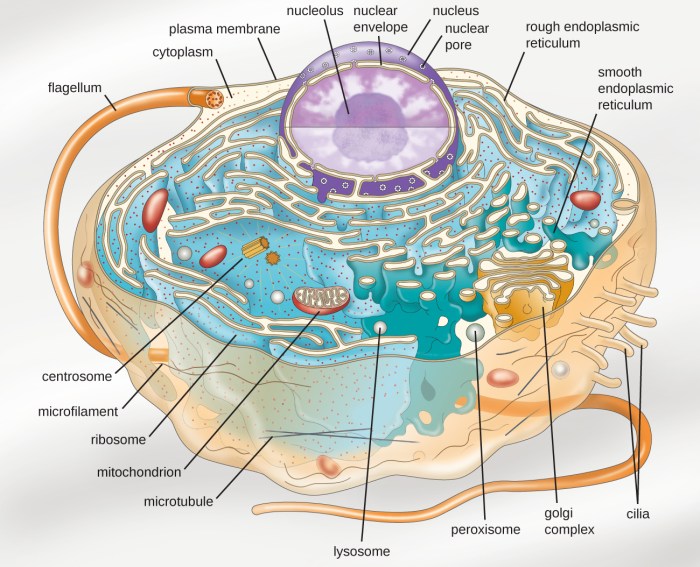
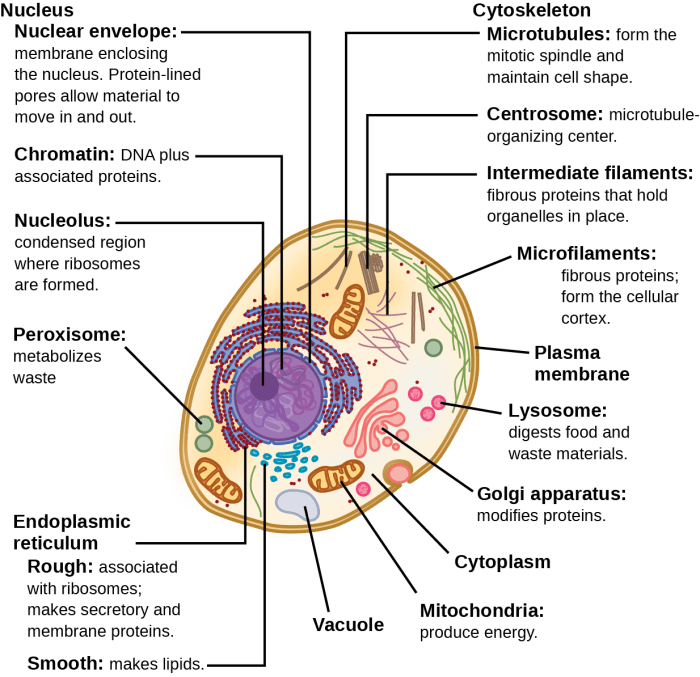
Eukaryotic animal cell coloring – Eukaryotic animal cells are complex and highly organized structures, the fundamental building blocks of animal life. Understanding their structure and the function of their various components is crucial to comprehending how animals develop, function, and interact with their environment. These cells are characterized by a membrane-bound nucleus and numerous other membrane-bound organelles, each with specialized roles in maintaining cellular life.The basic structure of an animal cell involves a variety of organelles working in concert.
These organelles are suspended within a cytoplasm, a jelly-like substance primarily composed of water, salts, and various organic molecules. The cell is enclosed by a selectively permeable cell membrane, regulating the passage of substances into and out of the cell. Key organelles include the nucleus, mitochondria, ribosomes, endoplasmic reticulum, Golgi apparatus, lysosomes, and sometimes centrioles.
The Nucleus: Control Center of the Cell
The nucleus is the largest and most prominent organelle in most animal cells. It houses the cell’s genetic material, DNA, organized into chromosomes. The DNA contains the instructions for building and maintaining the cell, directing all cellular activities. The nucleus is surrounded by a double membrane called the nuclear envelope, which is perforated by nuclear pores that regulate the transport of molecules between the nucleus and the cytoplasm.
Within the nucleus, a dense region called the nucleolus is responsible for ribosome synthesis.
Mitochondria: Powerhouses of the Cell
Mitochondria are often referred to as the “powerhouses” of the cell because they are responsible for generating most of the cell’s energy in the form of ATP (adenosine triphosphate) through cellular respiration. These organelles have a double membrane structure: an outer membrane and a highly folded inner membrane called the cristae. The cristae significantly increase the surface area available for the enzymes involved in ATP production.
Mitochondria also play a role in other cellular processes, including calcium storage and apoptosis (programmed cell death).
Ribosomes: Protein Factories
Ribosomes are small, complex structures composed of ribosomal RNA (rRNA) and proteins. They are the sites of protein synthesis, translating the genetic information encoded in messenger RNA (mRNA) into proteins. Ribosomes can be found free in the cytoplasm or attached to the endoplasmic reticulum. Free ribosomes typically synthesize proteins used within the cytoplasm, while ribosomes attached to the endoplasmic reticulum synthesize proteins destined for secretion or for incorporation into membranes.
Understanding the intricacies of eukaryotic animal cell coloring can be a rewarding, albeit challenging, task. The detailed structures often require meticulous attention, much like the careful shading needed for easy anime wolf coloring pages. However, the vibrant results, whether depicting cellular organelles or a stylized canine, offer a satisfying sense of accomplishment, reflecting the precision needed in both artistic and scientific endeavors.
Returning to the cellular level, accurate coloring helps in visualizing the complex interactions within the cell.
Cell Membrane: Selective Barrier
The cell membrane, also known as the plasma membrane, is a selectively permeable barrier that encloses the cell’s contents. It is composed primarily of a phospholipid bilayer, with hydrophilic (water-loving) heads facing outward and hydrophobic (water-fearing) tails facing inward. Embedded within this bilayer are various proteins that perform diverse functions, including transport of molecules, cell signaling, and cell adhesion.
The fluid mosaic model describes the cell membrane as a dynamic structure, with its components constantly moving and interacting. This selective permeability allows the cell to regulate the passage of substances, maintaining a stable internal environment. The membrane’s fluidity is crucial for many cellular processes, including cell growth, division, and movement. For example, the fluidity allows for the incorporation of new membrane components and the removal of old ones.
Interpreting Cell Diagrams and Color Coding

Cell diagrams are visual representations of the complex internal structures of cells. Effective color coding in these diagrams is crucial for understanding the organization and function of different organelles. By assigning specific colors to particular organelles, we can quickly grasp their spatial relationships and roles within the cell. This visual cue significantly enhances comprehension compared to diagrams relying solely on labels.Color coding facilitates the identification and differentiation of various organelles based on their function and location.
For example, consistently using green to represent chloroplasts in plant cells and blue to represent the nucleus in both plant and animal cells establishes a visual shorthand. This consistent color association aids in quick recognition and memorization of organelle identity and location. This standardized approach reduces ambiguity and improves the overall learning experience.
Examples of Misinterpretations Due to Inaccurate Color Choices
Inaccurate or inconsistent color choices in cell diagrams can lead to significant misinterpretations. For instance, using the same color for the Golgi apparatus and the endoplasmic reticulum could cause confusion regarding their distinct functions and spatial arrangements within the cell. Similarly, employing colors that are visually similar for the mitochondria and lysosomes could hinder accurate identification and understanding of their metabolic roles.
Such ambiguities can lead to inaccurate conclusions about cellular processes and interactions. A further example would be using a color associated with a particular function in one diagram but using it for a different organelle in another, which would lead to significant confusion for the viewer.
Interpreting a Complex Cell Diagram Using Color as a Guide
Imagine a diagram depicting a eukaryotic animal cell where the nucleus is consistently colored purple, the mitochondria are red, the endoplasmic reticulum is light blue, the Golgi apparatus is dark blue, and the lysosomes are orange. Following this color scheme, we can quickly identify the location of each organelle. The purple nucleus, centrally located, is easily distinguished. The numerous red mitochondria, scattered throughout the cytoplasm, are readily identified as the powerhouses of the cell.
The interconnected network of light blue endoplasmic reticulum, extending from the nucleus, is easily differentiated from the dark blue, more compact Golgi apparatus, often located near the nucleus. Finally, the smaller, orange lysosomes, dispersed within the cytoplasm, are easily distinguished as the cellular recycling centers. This consistent color coding allows for a rapid and accurate understanding of the cell’s complex organization and the spatial relationships between its various components.
Advanced Visualization Techniques

Moving beyond basic diagrams, visualizing eukaryotic animal cells in three dimensions and with interactive elements significantly enhances understanding of their complex structures and functions. These advanced techniques offer a dynamic and engaging way to explore the intricate details of cellular components and their interactions.Advanced visualization techniques for eukaryotic animal cells leverage computational power and sophisticated software to create detailed and immersive representations.
This goes beyond static images, providing interactive models that allow for exploration and manipulation of cellular structures, leading to a deeper comprehension of their roles in various biological processes.
Three-Dimensional Modeling of Eukaryotic Animal Cells
Three-dimensional (3D) modeling provides a powerful way to visualize the spatial relationships between organelles and other cellular components. Software packages can generate realistic 3D models based on microscopic images, allowing researchers and educators to rotate, zoom, and dissect the virtual cell. For instance, a 3D model could show the intricate network of the endoplasmic reticulum weaving through the cytoplasm, highlighting its connection to the nucleus and Golgi apparatus.
The advantage lies in the realistic representation of spatial organization, which is difficult to convey with two-dimensional diagrams. However, creating accurate 3D models requires substantial data and computational resources, which can be a significant limitation.
Interactive Cell Diagrams and Simulations
Interactive diagrams go beyond static visuals, allowing users to explore cell structures and functions in a dynamic way. These tools often incorporate animations and simulations, demonstrating processes like protein synthesis, cell division, or signal transduction. For example, an interactive diagram could show the step-by-step process of endocytosis, allowing users to manipulate the model and observe the changes in real-time.
The advantage is the increased engagement and improved understanding of dynamic processes. The disadvantage is the complexity of creating these interactive models, requiring specialized programming skills and potentially powerful computing hardware.
Comparison of Visualization Techniques, Eukaryotic animal cell coloring
The choice of visualization technique depends on the specific needs and resources available. A comparison of advantages and disadvantages is presented below:
| Technique | Advantages | Disadvantages |
|---|---|---|
| 2D Diagrams | Simple, easy to create, readily understandable | Limited spatial representation, lacks dynamic interaction |
| 3D Modeling | Realistic spatial representation, allows for detailed exploration | Requires substantial data and computational resources, can be complex to create |
| Interactive Diagrams/Simulations | Engaging, allows dynamic exploration of processes, improved understanding of dynamic processes | Complex to create, requires specialized skills and resources |
Software and Tools for Creating High-Quality Cell Diagrams
Several software packages facilitate the creation of high-quality cell diagrams and 3D models. These tools offer varying levels of complexity and functionality, catering to different needs and skill levels.A list of examples includes, but is not limited to, CellDesigner (for pathway diagrams), Blender (a general-purpose 3D modeling software that can be adapted for cellular structures), and specialized molecular visualization software such as PyMOL and Chimera.
These tools offer a range of features, from basic drawing capabilities to advanced 3D modeling and animation. The choice of software depends on the desired level of detail, the type of visualization required, and the user’s technical expertise.
